Cancer Copy Number Variants (CNVs): A Guide to Detection, Analysis, and Interpretation

Copy number variants (CNVs) have demonstrated immense clinical utility in the molecular diagnosis of many cancers. We briefly explore the basics of cancer CNVs and how labs are harnessing their diagnostic and prognostic power to improve patient care.

Introduction

Technologies that enable labs to detect, analyze, and interpret CNVs have become instrumental in the screening, diagnosis, prognosis, and monitoring of human disorders and diseases, including cancer.

The number of clinical applications of these tools is only expected to grow as researchers continue to deploy them to reveal more about CNVs’ role in human biology.

This guide offers a basic definition of CNV, briefly traces the history of its discovery and impact on clinical research, discusses its connection to cancer, and summarizes the technologies labs are using to unlock its clinical insights and inform care decisions.

1What is copy number variation (CNV)?

A gene copy number, or copy number variant, is the number of copies of a particular gene in the genotype of an individual.

The National Human Genome Research Institute defines a CNV as “when the number of copies of a particular gene varies from one individual to the next.” Redon et al. offer a quantified definition, describing a CNV as a DNA segment of one kilobase or larger that is present at a variable copy number in comparison with a reference genome.

Variations in copy number have been shown to be a key component in the human genome, influencing many of our traits, including our susceptibility to disease. It was originally thought that single nucleotide changes in DNA (also called single-nucleotide polymorphism or “SNP” for short) were the most prevalent and important form of genetic variation.1

But roughly two decades of research has revealed that CNVs comprise at least three times the total nucleotide content of SNPs. Since CNVs often encompass genes, they’ve been shown to play important roles both in human disease and drug response.

A brief history of CNV research

While anomalous structural changes have been observed in genes stretching back to the early 20th century, the modern concept of a copy number variant originated in the early 2000s.

As we mentioned before, most researchers until this time had seen genomic variation in humans through the lens of SNPs. But researchers like Charles Lee (currently with the Jackson Laboratory for Genomic Medicine), Michael Wigler (Cold Spring Harbor), and Stephen Scherer (Hospital for Sick Children, Toronto) were among the first to notice and document more genomic variation in the form of copy number variants.

As exhaustively laid out by Ingrid Lobo in a 2008 article published in Nature Education, it was Charles Lee who, in 2002, following a series of unsuccessful attempts to genotype patients, appears to have been the first to document observations “that healthy control patients showed major variations in their genetic sequences, with some having more copies of specific genes than others.” Lee then collaborated with Steven Scherer, “who had made similar observations, and together their labs used array-based comparative genomic hybridization approaches to measure the occurrence of these copy variants across the genome.”2

“Meanwhile,” Lobo explains, “Michael Wigler was also observing differences in copy numbers in healthy individuals using a complementary microarray technique involving representational oligonucleotide probes to detect amplifications and deletions in the genome.”

In 2004, these researchers published findings that “indicated large-scale variations in copy number were common and occurred in hundreds of places in the human genome, including areas coding for disease-related genes.”

BioDiscovery’s own VP of Sales, Dan Clutter, Ph.D., was fortunate enough to be on the frontline of CNV discovery at this time—helping equip researchers with microarray technologies that facilitated many of the initial studies into these variations.

Back then, when you looked at the genome at a molecular level, you expected to see two copies of every gene. But we started seeing variations in genes. At the time, most people talked about SNPs and changes in individual nucleotides.

When we saw changes in copy number, we were really surprised. And when we looked at cancer samples, we saw that variations were everywhere. Where you’d expect to see two copies of every gene, you were actually seeing giant pieces of DNA moving, disappearing, and amplifying. Then we came across labs doing treatments of various cancers with chemicals, compounds, anti-cancer compounds, and we would see the genome start to become normal again. It was astonishing.

In the early days of CV research, this was all done in cell cultures. It was a long time before we started sequencing human tumors to understand what was going on at a genomic level. Now, we’re doing single-cell sequencing, looking at a whole tumor and sequencing thousands of cells from that tumor. Some cells aren’t that disturbed. Others are. The evolution of CNV research has been truly fascinating.”

— Dan Clutter, VP of Sales, BioDiscovery

It would be roughly a decade from its discovery before CNV detection and analysis would be meaningfully applied in a clinical setting. During this time and since, thousands of publications marked a slow-moving explosion in our understanding of CNVs as researchers reveal more about their functions in human biology and usefulness in the clinic.

Below, we’ve excerpted a portion of the historical timeline presented in a recent review published in Biomedical Journal outlining the major milestones in CNV discovery and research. We’ve also compiled a few of the publications that mark these milestones through time.
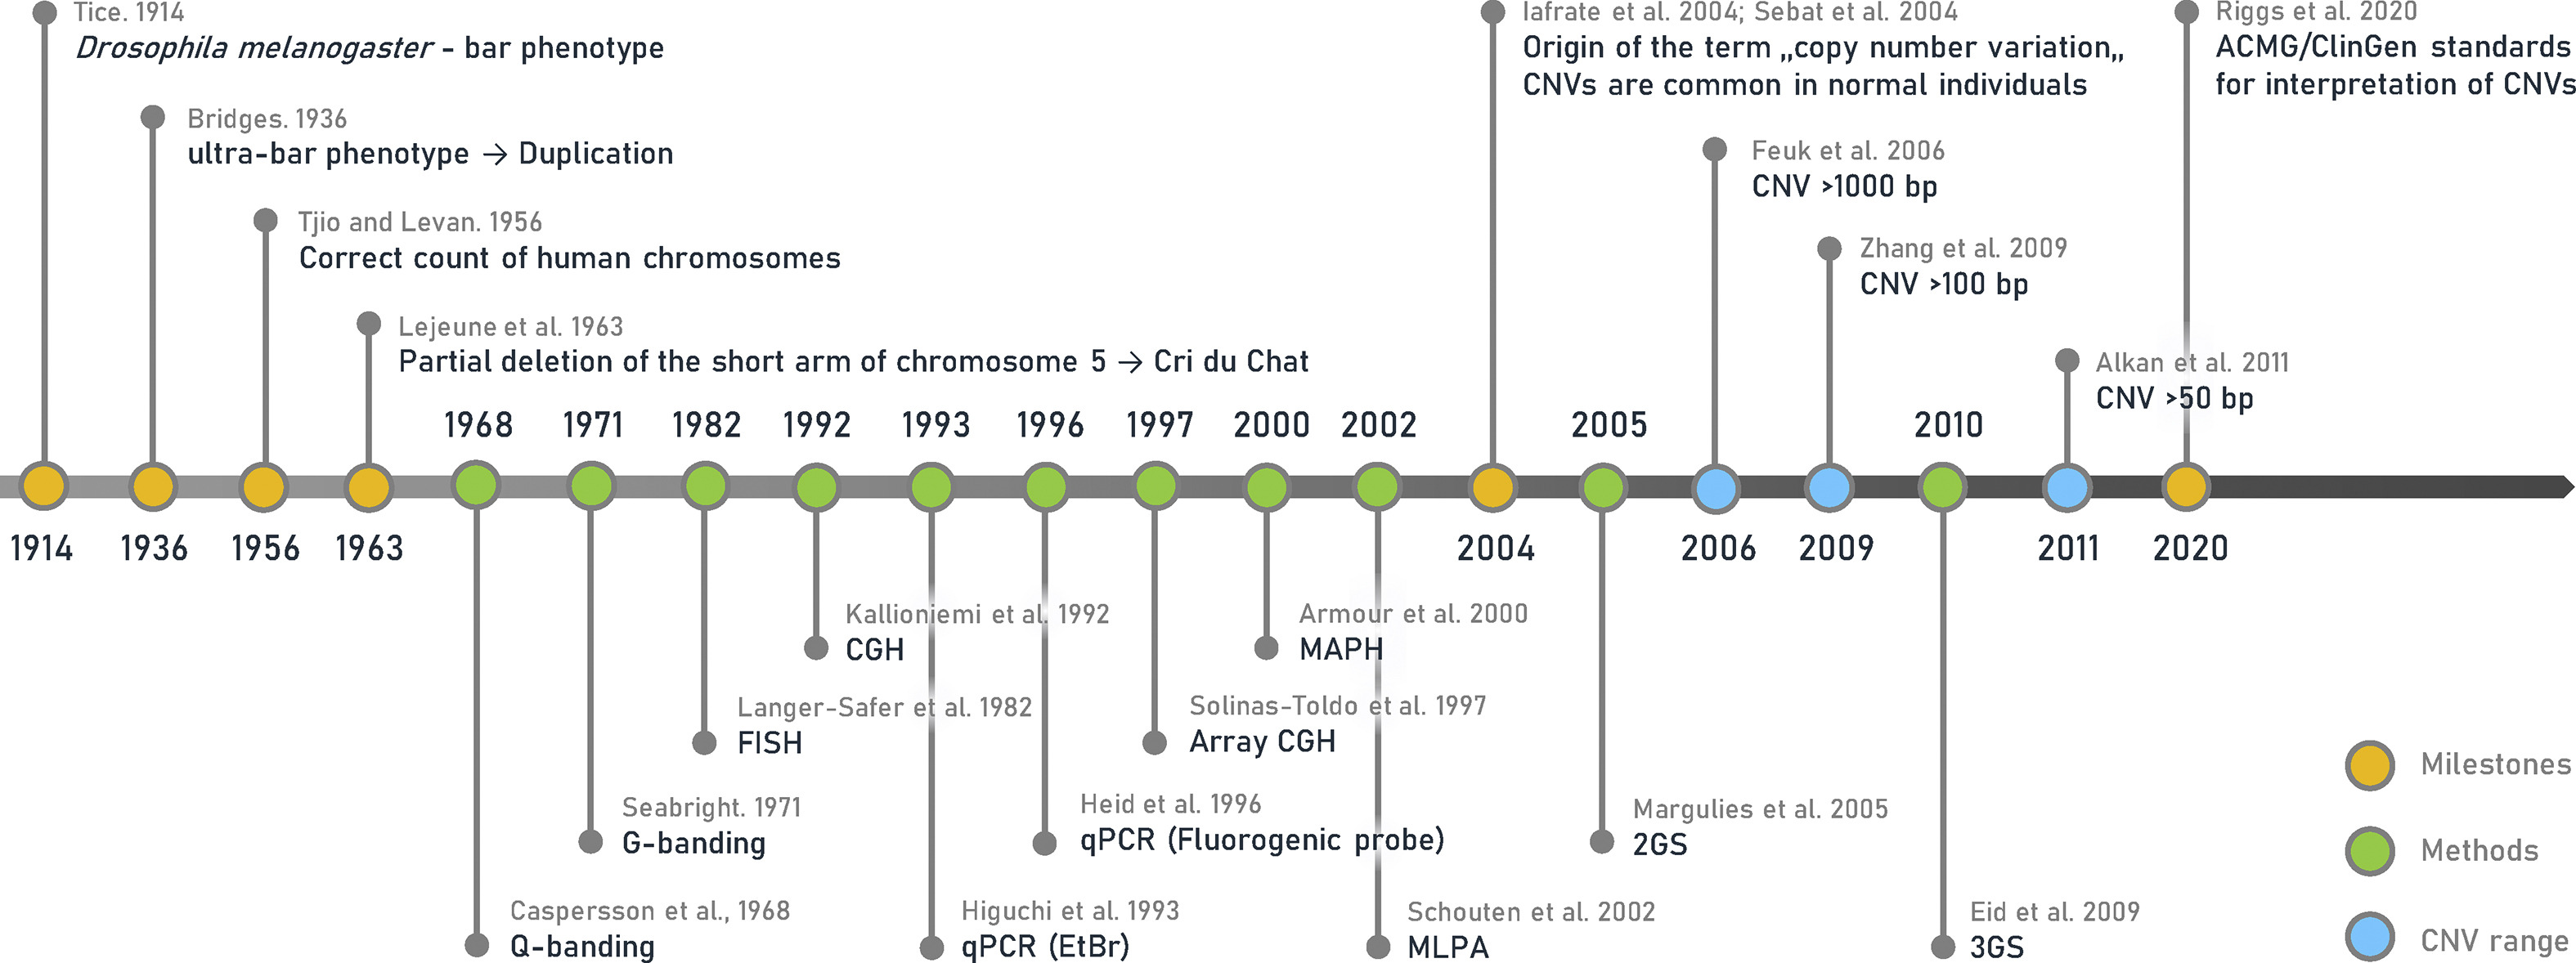
2Cancer CNVs: A brief overview2

Research into CNVs has produced many lines of evidence showing CNVs of certain genes are involved in how many types of cancer originate, develop, and progress—specifically through the alterations of their gene expression levels on individual or several cancer types.3 Clinically significant alterations can range from nucleotide-level insertions to deletions to entire chromosomes.

Shao et al. summarize some of the most notable research suggesting associations between CNVs and gene expression in cancers:

  • Samulin et al. found that Neurofascin (NFASC) gene is significantly amplified and overexpressed in non-small cell lung cancer (NSCLC) patients and the novel role of NFASC is identified in the regulation of cell motility and NSCLC migration.4
  • Dong et al. analyzed the copy number alterations and differentially transcribed genes in esophageal cancer and observed a noteworthy association between CNV and differential gene expression for FAM60A, TFDP1, CDC25B, and MCM2. Subsequently, FAM60A was identified as a potential prognostic factor with a striking correlation to overall survival and clinical-pathological parameters.5
  • Gut, Moch, and Choschzick found that SOX2 copy number increases correlated with SOX2 overexpression, suggesting that SOX2 gene amplification is the main mechanism for SOX2 overexpression in vulvar cancer.6,7

When I describe what cancer is, I try to get the point across that it’s really not one disease—it’s thousands of diseases. And in fact, it may be different for every single person. Our biology’s background mutational differences dictate what happens to new mutations—whether they’re effective or not and so on. It’s a complex and fascinating field, and it’s getting to a point now where people really understand the value at the clinical level, and they’re doing tests to look at diagnosis, prognosis, and so on.”

— Dan Clutter, VP of Sales, BioDiscovery

Other studies explored CNV and differential gene expression of several classical oncogenes or tumor suppressor genes in neuroblastoma,8 colorectal,9 and many other cancers.10 Detecting and analyzing CNVs has become central to diagnosing cancer at the molecular level. Research has shown that recurring deletions are typically overrepresented in tumor suppressor genes and underrepresented in oncogenes,11 and gene copy number aberrations (CNAs) may reveal therapeutic targets or markers of drug resistance in several types of cancer.12

Today, many clinical labs at the forefront of genomic capabilities sequence patient samples based on CNVs rather than SNPs to determine clonal evolutions—particularly the set of mutations that dominate a cell, which can often then be used to treat a disease. When looking at the copy number changes in a healthy person, one might see less than a handful of them. But the millions of SNPs present within every individual make it comparatively difficult to determine which are important for a particular disease.

Common aberrations

Since the discovery of CNVs, researchers have revealed and documented a vast amount of CNA data generated by molecular-cytogenetic and genome sequencing-based methods.

This data has proved critical for identifying cancer-related genes and promoting further research into the relation between CNAs and various types of cancer. Most of this research has been focused on the association of CNA to common driver genes.13

A recent article published in Frontiers in Genetics offers a comprehensive background of CNV profiling for cancer and presents CNA signatures for 31 cancer subtypes. A complete list is included in the article’s Supplementary Signatures.

Here’s a sample of three common cancer subtype CNV signatures presented in this research:

brain cancer cnv signatures

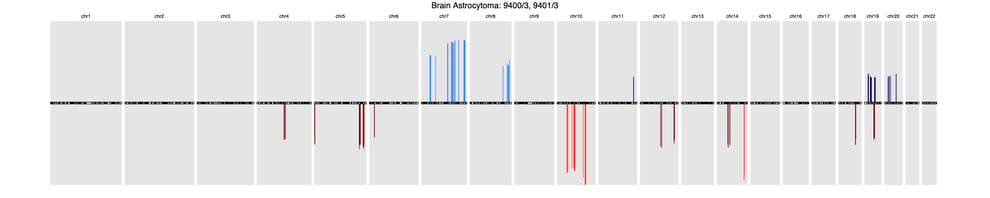
BrainBrain astrocytoma (9400/3, 9401/3)

breast cancer cnv signatures

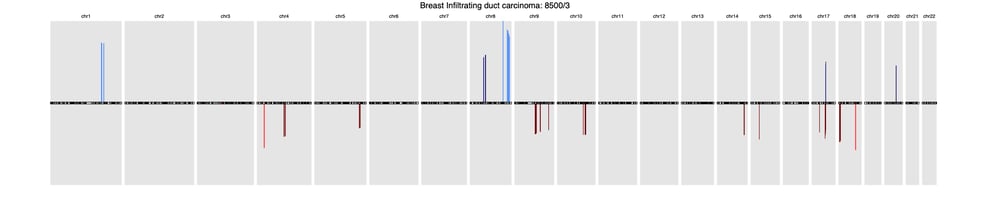
BreastBreast Infiltrating duct carcinoma (8500/3)

lung cancer cnv signatures

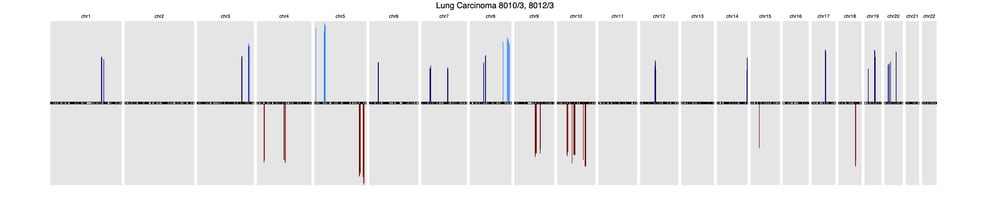
LungLung carcinoma (8013/3, 8012/3)

Accurately detecting, analyzing, and interpreting CNVs has become a routine and process in investigating tumor cells and diagnosing tumor patients.

Here at BioDiscovery, for example, we’ve built software that compares patient samples against the global CNV signature databases as well as a proprietary library of hundreds of different cancers to return the closest matches.

Our platform integrates many external databases to aid with interpretation, databases include OMIM*, DECIPHER, ClinGen (Prenatal, Postnatal, Dosage Sensitive), CIViC, Segmental Duplications, and more.

Learn more about our platform and its capabilities here.

Additional aberrations (AOH and mosaicism)

Absence of heterozygosity (AOH) is another genetic characteristic known to cause genetic disorders through autosomal recessive or imprinting mechanisms—making it another hallmark of diseases including cancer.

“When looking at B-Allele Frequency (BAF) in the allele profile of the normal genome, you’ll find three bands: AA, AB, and BB. If an AOH region is present, you won’t see a copy number loss or change. You won’t know it was there, except that you lose the AB, and it becomes homozygous. So the BAF plot becomes really clear that there are only two alleles when there should be three. It turns out that this is also one of the signals of certain diseases and cancer is one of them.”

— Dan Clutter, Ph.D., VP of Sales, BioDiscovery

Here at BioDiscovery, we often work with labs focusing on AOH for cancer detection. The signatures link to certain cancers can also be found in clinical databases, which our software can conveniently and efficiently query.

Moscasism is another type of aberration that, when analyzed and interpreted accurately, can provide clinical insights into cancer.

“In cancer, it’s very difficult to get a pure tumor sample. Just about every time you excise a tumor, the sample will contain some normal tissue. So, a lot of the samples we look at have mosaicism; there are multiple cell types present rather than a single cell type. That’s another area of focus for many of the cancer labs we work with. They know certain things are mosaic, and certain things shouldn’t be. It becomes another hallmark of cancer and our platform can quickly unlock those insights through a convenient interface.”

— Dan Clutter, Ph.D., VP of Sales, BioDiscovery

Our platform has helped many researchers to detect and interpret the profiles from cancer samples where contamination by normal cells is quite common.

It’s important to note, however, that mosaic events can also appear as the clonal expansion of acquired post-zygotic mutations. Compared to constitutional defects in the same regions, mosaic abnormalities can result in milder phenotypes but they may also appear in otherwise seemingly healthy individuals.

Additional genomic classifications

Homologous recombination is one of the major mechanisms of defective DNA repair and frequently occurs in cancer. It’s emerging as both a promising biomarker and treatment vector for some types of disease. The genomic scarring often left by homologous recombination—commonly referred to as homologous recombination deficiency (HRD)—is now the subject of intense research and discussion to understand and reach a consensus on what information HRD contains as it pertains to a current or potential disease state.

While multiple consortiums attempt to harmonize and develop a standard for quantifying or scoring HRD, it appears that many in the field have accepted an HRD scoring model put forward in a 2020 article published in the Journal of Clinical Oncology.

This model establishes, for example, how many CNVs, breakpoints, and areas of AOH there may be in a patient sample with HRD and combine this data to arrive at an HRD score—much like in quantifying minimal residual disease (MRD) or tumor mutational burden (TMB).

NxClinical currently calculates HRD scores using a rules-based decision tree model to classify and quantify Genomic Scarring in the form of Loss of Heterozygosity (HRD-LOH), Telomeric Allelic Imbalance (TAI), and Large-Scale State Transition (LST). NxClinical's HRDScore is the sum of all of these Genomic Scars.

Learn more on HRD scoring in our 3-minute explainer video below here.

3Technologies used for cancer CNV detection and analysis

Low-resolution karyotypes, further refined by fluorescence in situ hybridization (FISH), were the technologies used to identify the first CNVs.

Microarray technology then improved the resolution of detection and analysis, with comparative genome hybridization (CGH) and then several other methods emerging. These include SNP arrays, DNA methylation arrays, and next generation sequencing (NGS).

We briefly explore each of these technologies below.

Microarray CNV detection

Microarrays are commonly used to detect CNVs that contribute to diseases and phenotypes. Microarray-based approaches for CNV analysis generally offer fast and reliable analysis at the scale needed in many clinical contexts. With the right platform capabilities, labs can process multiple samples on a single microarray to survey genomic structural variation and profile aberrations such as amplifications, deletions, rearrangements, and copy-neutral loss of heterozygosity.

There are two types of microarrays most commonly used for CNV detection and analysis due to their efficiency in both research and clinical applications: array-based comparative genomic hybridization (aCGH) and SNP-based microarrays (SNP-arrays).

Several factors, including desired resolution and the need for probe customization, should be considered when determining which type of microarray is most suitable. Coughlin et al. provide an instructive table comparing the differences between these two microarrays in terms of their probes, experimentation, resolution, and applications. These researchers also detail some of the primary abilities and limitations of using these microarrays in CNV detection, which we’ve excerpted directly in the sections below.

A few abilities of microarrays for CNV detection and analysis:

  • “Both aCGH and SNP-arrays can detect low-level mosaicism, which would be missed by traditional cytogenetic testing and may provide a more accurate measurement of mosaicism level.”14-16
  • “...SNP-arrays have an additional advantage that they may help determine whether [a] mosaic cell line originated from a meiotic or mitotic event.”17,18
  • “In addition to determining copy number alterations, the genotype information provided by SNP-arrays allows the identification of copy number neutral loss of heterozygosity (LOH). This helps in identifying regions that are homozygous due to segmental uniparental disomy or parent of common origin effect, both of which can result in a disease phenotype if a disease gene within the segment is mutated or silenced by imprinting.”19,20

A few limitations of microarrays for CNV detection and analysis:

  • “Pathogenic duplications are less commonly identified through clinical microarray-based testing than pathologic deletions. This may be due partially to technical limitations of identifying small duplications…”21,22
  • “...microarray-based analysis will not detect genomic alterations that do not result in changes in the amount of genetic material (copy neutral alterations), such as balanced translocations and inversions.”
  • “...an important disease mechanism in any CNV is the possible interruption of a critical gene. This is true of both small CNV and large genomic alterations. Balanced translocations can also result in a disease phenotype if the breakpoints of translocation reside within a coding region or ultraconserved element. Although the mechanism for disease may be similar, due to the neutral copy number change associated with a balance translocation, the etiology for disease will go unrecognized by microarray-based CNV analysis.”

Oligonucleotide arrays

Oligonucleotides provide high potential resolution for array-CGH. These microarrays are usually made by in situ synthesis on glass, using a combination of photolithography and oligonucleotide chemistry,23 although some manufacturers make their arrays by spotting conventionally synthesized oligonucleotides.

Despite potentially high resolutions, oligonucleotide arrays are sometimes hampered by a poor signal-to-noise ratio of hybridizations. This can lead to significant variation in reported CGH ratio. The design of the sequences used on these arrays is another major consideration. Little useful data can be generated by array-CGH from highly repetitive regions of the genome. As a result, it’s common practice to consider only the repeat-masked fraction—little more than half of the human genome—for sequence design.24

SNP arrays

High-resolution SNP genotyping arrays offer a sensitive method for genome-wide detection of CNVs. SNP arrays use fewer samples per experiment compared to other techniques (like CGH arrays). SNP arrays also offer a comparatively cost-effective technique, enabling labs to test more samples with a limited budget.

Unlike aCGH analysis, which queries a single sequence on each oligonucleotide (and misses certain chromosomal anomalies as a result), having multiple SNPs at each locus provides more information at each site, enabling researchers to detect these potentially pathogenic anomalies.

In a 2019 article published in Prenatal Diagnosis, Brynn Levy and Rachel D Burnside more exhaustively explore the differences between CGH-based and SNP arrays—a great resource for those interested in diving deeper into the technique.

Amber Boys, Senior Medical Scientist in the Division of Genetics and Genomics at the Victorian Clinical Genetics Services in Melbourne, recently joined us for a webinar on the topic of genomic variation analysis and interpretation of SNP microarray data.

Methylation arrays

Amid the success of SNP arrays, the importance of methylation and its function in gene regulation begged the question: Is there a way to use these arrays to determine methylation levels on the genome? Researchers became increasingly interested in integrating genomic and epigenomic data from a DNA specimen to potentially unlock greater insight into disease processes.

Since then, new technologies and methods enabled the use of array-based DNA methylation data to call CNVs. Today, ChAMP, Conumee, and cnAnalysis450k are popular methods currently used to call CNVs using methylation data.

Kilaru et al. offer an exhaustive critical evaluation of these methods in a 2020 article published in Genetic Epidemiology.25

NxClinical

While CNV detection and analysis has been the focus of various technology platforms since CNV’s discovery, only somewhat recently has technology been made available to conveniently visualize CNV data for clinical researchers. As demand for visualization capabilities grew, BioDiscovery was the first to bring it to life.

Since the release of our first-of-its-kind CNV visualization tool more than a decade ago, NxClinical has grown into a single-source platform for calling, analyzing, and interpreting a variety of sample data—increasing the accuracy and efficiency in molecular genetics and cytogenomics labs' workflows.

NxClinical's platform independence allows labs to use the same software for analysis and interpretation of data from any technology (e.g. aCGH arrays, SNP arrays, and NGS) allowing much greater flexibility and ease in adopting the best technology for a lab without having to invest additional time and money in installation, training, and validation with a new system. The system includes best-in-class algorithms for copy number estimation and numerous filters to quickly narrow down the list of variants to those that are relevant.

Learn more about NxClinical here.

Next generation sequencing

For years, karyotype and microarray methods were the gold standards in CNV molecular diagnostics. But the inherent limitations of these technologies and methodologies ran up against the realization that more—and more complex—possible genomic changes required a testing technology that could acknowledge all cytogenetic abnormalities and smaller structural variants (SVs).

Sequencing offered the way forward, providing greater sensitivity and specificity for SNVs, and demonstrated the “ability to detect complex repeat expansions,26 CNVs,27,28 and SVs.”29,30

Several studies have demonstrated that various approaches for enabling CNV detection as a component of gene panel or exome sequencing analysis had improved diagnostic yield.31-33

“NGS entered the CNV space a little over ten years ago because it was faster and had higher throughput. With advancements in genomics, the predictions about decreased costs of sequencing humans made years ago have mostly come true. But from a practical standpoint, that means generating—and dealing with—terabytes of data. It’s hard for most computers even today to store and process that much data. The time, complexity and computing power needed to do whole genome sequencing simply isn’t feasible for most clinical research labs. They need their workflows to be simple and fast.”

— Dan Clutter, Ph.D., VP of Sales, BioDiscovery

Given the practical challenges of whole genome sequencing (WGS), whole exome sequencing (WES) offered a more sensible approach—essentially aiming for the smallest piece of the genome that would be clinically relevant to a patient. WES enabled most labs to ignore about 98 percent of the genome to focus only on the one or two percent assumed to be clinically relevant.

“The assumption initially was only that the ‘important stuff’ happens inside—and not outside—exomes. Well, that turned out to be false. There was ‘important stuff’ outside of the exome!”

— Dan Clutter, Ph.D., VP of Sales, BioDiscovery

In practice, even WES is prohibitively complex and taxing for most clinical research labs to process. Once it was discovered that the initial assumptions around exomes weren’t accurate, gene panels emerged as a solution.

“A lot of diagnostic labs only start with panels. They’ll run a microarray to see if anything jumps out at them. Then they’ll run a focus panel for their particular cancer based on family history or other indications. Sometimes they see something. A lot of times they don’t. It’s in these situations they turn to WES and perhaps even WGS to broaden their analysis. This is more or less where clinical research labs are today.”

— Dan Clutter, Ph.D., VP of Sales, BioDiscovery

NxClinical

In the years since sequencing started being used for CNV detection, it’s demonstrated itself to be more of a challenge than many originally thought. Dozens of freeware software packages have been made available—and studied—to understand relative strengths and weaknesses. This fragmented software ecosystem has prompted many labs to essentially string together a handful of various tools to get the detection analysis capabilities they need. Here at BioDiscovery, we routinely help clinical research labs avoid years-long investments in what are often depreciated, academic-focused niche tools, to instead move to a far more convenient and powerful single-source platform in NxClinical.

“We often engage clinical research labs planning to integrate NGS freeware into their workflow and are excited about a few features. While it’s totally possible to achieve great things with freeware, what can seem like a 'free' solution ends up costing quite a bit more once the downsides come into view. Most NGS freeware isn’t designed for clinical research labs that need it to do many things well. These tools are typically made for academic researchers looking to do just one or two things. There’s typically a lack of any robust visualization engine that clinical research labs need to be efficient, and they’re seldom, if ever, subject to upgrades.

With NxClinical, labs can analyze CNVs from low-pass WGS, WES, and panels based on the need at hand. It accommodates any approach a lab wants to take—whether it’s big or small—expensive or less expensive. Rather than being tied to disparate systems tied to your sequencer versus your microarrays, NxClinical can use all of that data, and stay with your lab for decades as you grow and change the technologies that surround it.”

— Dan Clutter, Ph.D., VP of Sales, BioDiscovery

Optical genome mapping

Cancer samples are just too complex for low coverage whole-genome sequencing. Complex rearrangements, as well as unsequenceable regions of the genome, present an additional challenge for short and long-read sequencing technologies. Bionano Optical Genome Mapping (OGM) detects unbiased structural variations at sensitivities much higher than sequencing-based technologies, and down to 1% variant allele fraction.

Bionano OGM uncovers large structural variations beyond what short and long-read sequencing can see.

Bionano OGM directly visualizes patterns of labels on megabase-size intact DNA molecules, at up to 1600X coverage, to detect structural variations. Every type of structural variant is detected with sensitivities as high as 99%, and with a positive predictive value of more than 97%. OGM can detect balanced translocations, repeat expansions, events flanked by repeats, and even rearrangements of large segmental duplications. Unlike sequencing-based methods which are typically unable to detect insertions or identify where the extra sequence is inserted, OGM detects both deletions and insertions starting at 500 bp with high sensitivity. Because it uses single-molecule imaging technology, it can detect mosaic variants down to as little as 1% variant allele fraction.

To learn more about cancer applications for optical genome mapping watch this presentation by Dr. Ben Finlay, SBP Discovery Center.

Bionano Saphyr: A Structural Variation Discovery Platform

Resolve large-scale structural variants missed by NGS systems

Large structural variations are responsible for many diseases and conditions, including cancers. Optical genome mapping with Saphyr detects structural variations ranging from 500 bp to megabase pairs in length and offers assembly and discovery algorithms that far outperform sequencing-based technologies in sensitivity. Learn more or request a demo.

4NxClinical for clinical labs

Detect CNVs and AOH regions, and visualize SNVs in context across all microarray and NGS platforms simultaneously. All from a single screen.

NxClinical-Software-Display-VD-Tab

NxClinical is the most comprehensive single-software cytogenetics and molecular genetics solution for analyzing and interpreting CNV, SNV, and AOH data across all platforms for patient samples.

BioDiscovery’s CNV calling algorithms are the gold standard in the field for deriving CNVs from microarrays and NGS. BioDiscovery’s MSR algorithm makes it possible to obtain copy number from a variety of NGS data (WES, WGS, targeted panels, shallow sequencing). This allows clinical labs to get the most out of a single NGS assay—copy number, AOH, and sequence variants from the same assay streamlines the process and saves time and money.

Here are just a few of the reasons renowned clinical labs put NxClinical at the center of their cancer workflows:

It enables clinical labs to resolve cases faster and minimize TAT.

Your lab—and the patients who rely on it—shouldn’t be stymied by constant software switching and unassisted sample interpretation. NxClinical detects, analyses, and visualizes genomic variants in one place. Simplify your clinical toolset while strengthening it with automation, AI, and variant prioritization tools that trim the list of potentially causative variants from hundreds or thousands to a handful. Make more informed decisions faster with fewer tools.

It enables labs to put their past case data to work (finally).

Clinical labs have long-deserved a genomic variant analysis tool that lets them fully utilize the data they already have. NxClinical enables you to finally extract the valuable CNV data from all your previous cases (yes, all of them) and compare them to your new ones. Automatically build a case history of analyzed samples and put it to work to continually improve your classifications.

It offers the visualization and interpretation capabilities labs need, but freeware can’t provide.

Freeware isn’t free. Labs pay for it through a lack of capabilities, support, and updates—not to mention the inefficiencies they impose day after day. NxClinical delivers a level of value that far exceeds its cost. Unlike freeware’s lackluster (and often absent) visualization capabilities, NxClinical presents all the important information your lab needs to evaluate an event together on a single screen—unlocking new opportunities for quick and confident variant interpretation. Close-knit support and regular updates offer far more than any freeware can provide.

Simplify your lab’s case review workflow and make the right call in record time.

Want to learn more about NxClinical?

Find a wealth of information, videos, and more, or get a general overview on our NxClinical product page. Want to see NxClinical in action? Request a free personalized demo to assess fit and see NxClinical in action.

Let us know you’re interested and we’ll connect on an initial consultation to answer questions and dive a little deeper before demonstrating NxClinical—either with example data or your own. Have questions? Get in touch with us here.

*This database/product contains information obtained from the Online Mendelian Inheritance in Man® (OMIM®) database, which has been obtained through a license from the Johns Hopkins University, which owns the copyright thereto.

**NxClinical software is for research use only. It is designed to assist clinicians and it is not intended as a primary diagnostic tool. It is each lab’s responsibility to use the software in accordance with internal policies as well as in compliance with applicable regulations.

References:

1. Redon, R., et al. Global variation in copy number in the human genome. Nature 444, 444–454 (2006) 

2. Check, E. Patchwork people. Nature 437, 1084–1086 (2005) 

3. Shao, X., Lv, N., Liao, J. et al. Copy number variation is highly correlated with differential gene expression: a pan-cancer study. BMC Med Genet 20, 175 (2019).

4. Samulin Erdem J, Arnoldussen YJ, Skaug V, Haugen A, Zienolddiny S. Copy number variation, increased gene expression, and molecular mechanisms of neurofascin in lung cancer. Mol Carcinog. 2017;56:2076–85.

5. Dong G, Mao Q, Yu D, Zhang Y, Qiu M, Dong G, et al. Integrative analysis of copy number and transcriptional expression profiles in esophageal cancer to identify a novel driver gene for therapy. Sci Rep. 2017;7:42060.

6. Gut A, Moch H, Choschzick M. SOX2 gene amplification and overexpression is linked to HPV-positive vulvar carcinomas. Int J Gynecol Pathol. 2017;37:68–73.

7. Zhao M, Zhao Z. Concordance of copy number loss and downregulation of tumor suppressor genes: a pan-cancer study. BMC Genomics. 2016;17(Suppl 7):532.

8. Kuzyk A, Booth S, Righolt C, Mathur S, Gartner J, Mai S. MYCN overexpression is associated with unbalanced copy number gain, altered nuclear location, and overexpression of chromosome arm 17q genes in neuroblastoma tumors and cell lines. Genes Chromosomes Cancer. 2015;54:616–28.

9. Kwak Y, Nam SK, Seo AN, Kim DW, Kang SB, Kim WH, et al. Fibroblast growth factor receptor 1 gene copy number and mRNA expression in primary colorectal Cancer and its Clinicopathologic correlation. Pathobiology. 2015;82:76–83.

10. Budczies J, Bockmayr M, Denkert C, Klauschen F, Groschel S, Darb-Esfahani S, et al. Pan-cancer analysis of copy number changes in programmed death-ligand 1 (PD-L1, CD274) - associations with gene expression, mutational load, and survival. Genes Chromosomes Cancer. 2016;55:626–39.

11. Zhang L, Yuan Y, Lu KH, Zhang L. Identification of recurrent focal copy number variations and their putative targeted driver genes in ovarian cancer. BMC Bioinformatics. 2016;17(1):222. 

12. Peng H, Lu L, Zhou Z, et al. CNV Detection from Circulating Tumor DNA in Late Stage Non-Small Cell Lung Cancer Patients. Genes (Basel). 2019;10(11):926.

13. Gao B, Baudis M. Signatures of Discriminative Copy Number Aberrations in 31 Cancer Subtypes. Front Genet. 2021;12:654887. Published 2021 May 13.

14. Ballif BC, Rorem EA, Sundin K, et al. Detection of low-level mosaicism by array CGH in routine diagnostic specimens. Am J Med Genet A. 2006;140(24):2757-2767.

15. Cheung SW, Shaw CA, Scott DA, et al. Microarray-based CGH detects chromosomal mosaicism not revealed by conventional cytogenetics. Am J Med Genet A. 2007;143A(15):1679-1686.

16. Scott SA, Cohen N, Brandt T, Toruner G, Desnick RJ, Edelmann L. Detection of low-level mosaicism and placental mosaicism by oligonucleotide array comparative genomic hybridization. Genet Med. 2010;12(2):85-92.

17. Conlin LK, Thiel BD, Bonnemann CG, et al. Mechanisms of mosaicism, chimerism and uniparental disomy identified by single nucleotide polymorphism array analysis. Hum Mol Genet. 2010;19(7):1263-1275.

18. González JR, Rodríguez-Santiago B, Cáceres A, et al. A fast and accurate method to detect allelic genomic imbalances underlying mosaic rearrangements using SNP array data. BMC Bioinformatics. 2011;12:166.

19. Gibson J, Morton NE, Collins A. Extended tracts of homozygosity in outbred human populations. Hum Mol Genet. 2006;15(5):789-795.

20. Li LH, Ho SF, Chen CH, et al. Long contiguous stretches of homozygosity in the human genome. Hum Mutat. 2006;27(11):1115-1121.

21. Locke DP, Sharp AJ, McCarroll SA, et al. Linkage disequilibrium and heritability of copy-number polymorphisms within duplicated regions of the human genome. Am J Hum Genet. 2006;79(2):275-290.

22. Sudmant PH, Kitzman JO, Antonacci F, et al. Diversity of human copy number variation and multicopy genes. Science. 2010;330(6004):641-646.

23. Pease AC, Solas D, Sullivan EJ, Cronin MT, Holmes CP, Fodor SP. Light-generated oligonucleotide arrays for rapid DNA sequence analysis. Proc Natl Acad Sci U S A. 1994;91(11):5022-5026.

24. Carter NP. Methods and strategies for analyzing copy number variation using DNA microarrays. Nat Genet. 2007;39(7 Suppl):S16-S21.

25. Kilaru V, Knight AK, Katrinli S, et al. Critical evaluation of copy number variant calling methods using DNA methylation. Genet Epidemiol. 2020;44(2):148-158.

26. Lupski JR. Structural variation mutagenesis of the human genome: Impact on disease and evolution. Environ Mol Mutagen. 2015;56(5):419-436.

27. Roller E, Ivakhno S, Lee S, Royce T, Tanner S. Canvas: versatile and scalable detection of copy number variants. Bioinformatics. 2016;32(15):2375-2377.

28. Abyzov A, Urban AE, Snyder M, Gerstein M. CNVnator: an approach to discover, genotype, and characterize typical and atypical CNVs from family and population genome sequencing. Genome Res. 2011;21(6):974-984.

29. Sudmant PH, Rausch T, Gardner EJ, et al. An integrated map of structural variation in 2,504 human genomes. Nature. 2015;526(7571):75-81.

30. Gross AM, Ajay SS, Rajan V, Brown C, Bluske K, Burns NJ, Chawla A, Coffey AJ, Malhotra A, Scocchia A, Thorpe E, Dzidic N, Hovanes K, Sahoo T, Dolzhenko E, Lajoie B, Khouzam A, Chowdhury S, Belmont J, Roller E, Ivakhno S, Tanner S, McEachern J, Hambuch T, Eberle M, Hagelstrom RT, Bentley DR, Perry DL, Taft RJ. Copy-number variants in clinical genome sequencing: deployment and interpretation for rare and undiagnosed disease. Genet Med. 2019 May;21(5):1121-1130.

31. Tian X, Liang WC, Feng Y, et al. Expanding genotype/phenotype of neuromuscular diseases by comprehensive target capture/NGS. Neurol Genet. 2015;1(2):e14. Published 2015 Aug 13.

32. Eisenberger T, Neuhaus C, Khan AO, Decker C, Preising MN, Friedburg C, Bieg A, Gliem M, Charbel Issa P, Holz FG, Baig SM, Hellenbroich Y, Galvez A, Platzer K, Wollnik B, Laddach N, Ghaffari SR, Rafati M, Botzenhart E, Tinschert S, Börger D, Bohring A, Schreml J, Körtge-Jung S, Schell-Apacik C, Bakur K, Al-Aama JY, Neuhann T, Herkenrath P, Nürnberg G, Nürnberg P, Davis JS, Gal A, Bergmann C, Lorenz B, Bolz HJ. Increasing the yield in targeted next-generation sequencing by implicating CNV analysis, non-coding exons and the overall variant load: the example of retinal dystrophies. PLoS One. 2013 Nov 12;8(11):e78496.

33. Truty R, Paul J, Kennemer M, Lincoln SE, Olivares E, Nussbaum RL, Aradhya S. Prevalence and properties of intragenic copy-number variation in Mendelian disease genes. Genet Med. 2019 Jan;21(1):114-123.

WEBINARAnalysis & Interpretation of CNV, AOH, and Seq Var of FFPE Cancer Samples

Dr. Sarah Murray

Director of Genomics Technologies University of California San Diego

View webinar